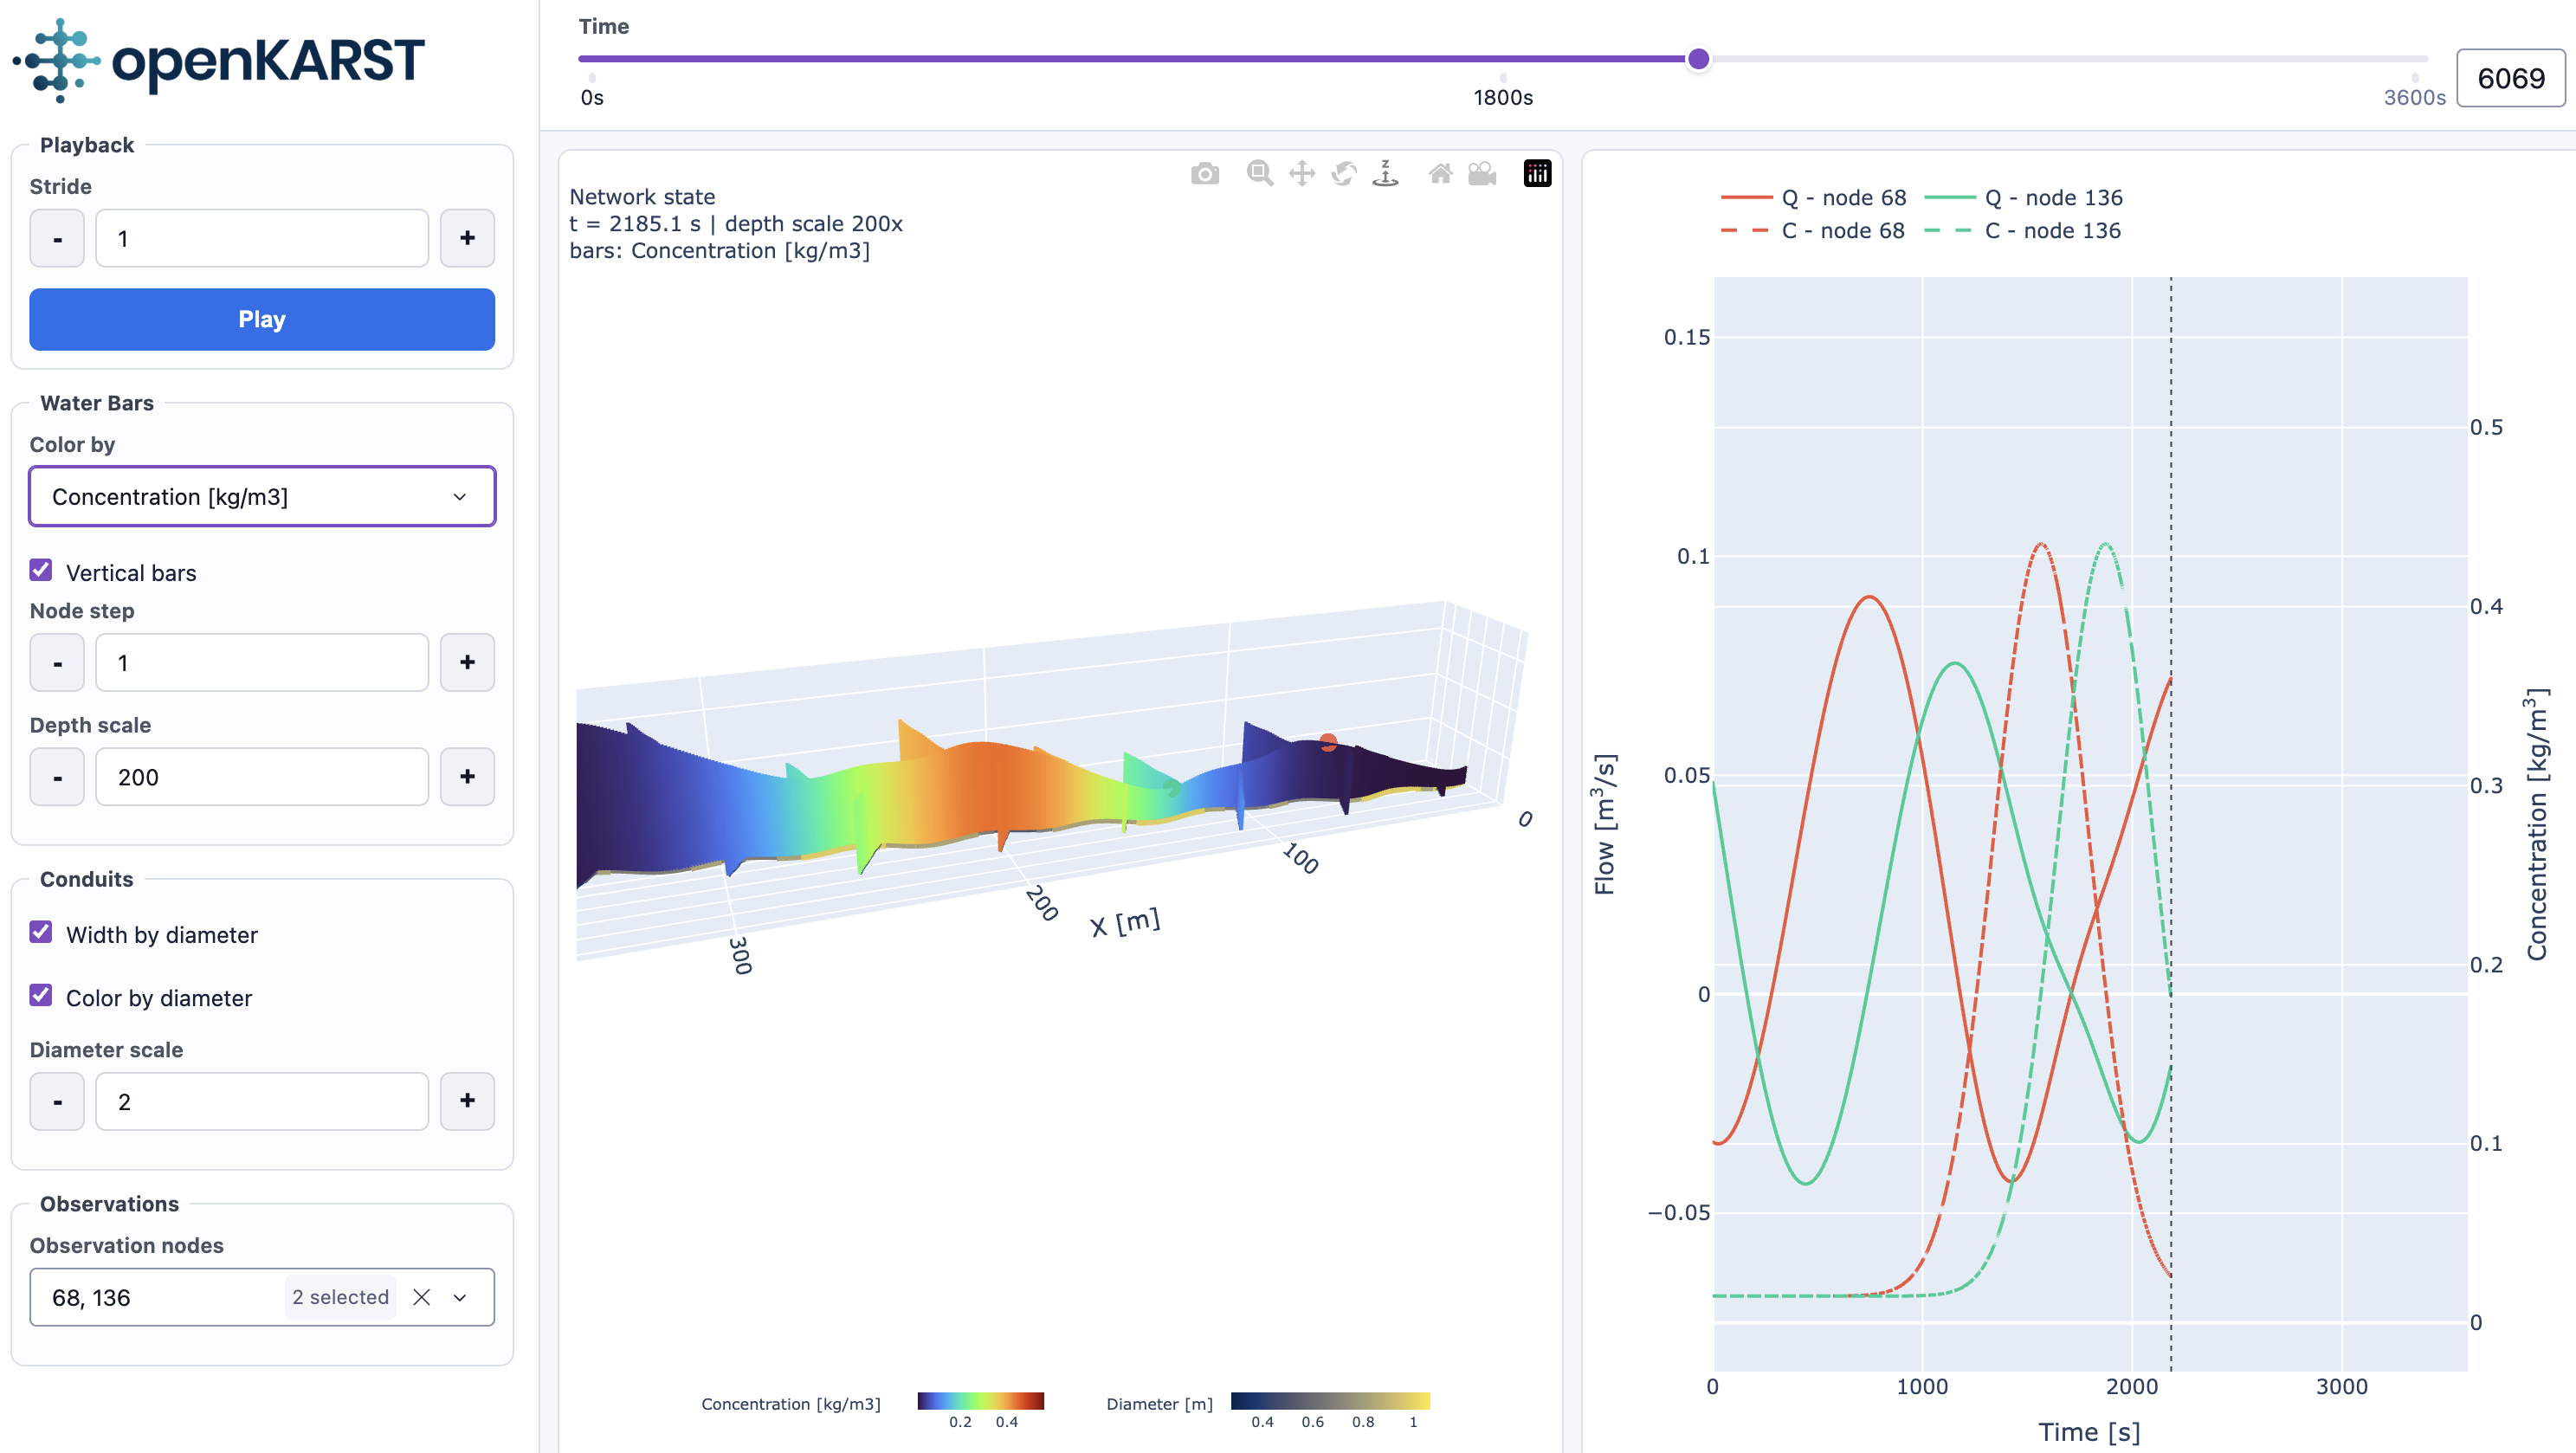
Use the 3D viewer
openKARST includes a browser-based viewer built with Dash and Plotly. Use it to inspect steady-state or transient results, flow rates, water depths, and observation time series.
Launch the viewer
from openkarst.visualization import launch_openkarst_viewer

flow.set_observation_points(
    nodes=[0, 19],
    variables=["water_depth", "connected_abs_flowrate", "connected_net_flowrate"],
    interval=1.0,
    name="boundary_nodes",
)

results = flow.run_simulation(desired_outputs=outputs)
obs_df = flow.get_observation_dataframe()

launch_openkarst_viewer(results, network, obs_df)
Pass the combined dataframe from get_observation_dataframe() to the viewer.
Do not pass the separate dictionary returned by get_observation_dataframes().
Recorder names are optional for viewer use; they only matter if you later need
to inspect the separate tables returned by get_observation_dataframes().
Mixed observation groups
If every observed node in a recorder has a reservoir, standard node variables and reservoir variables can be recorded together:
flow.set_observation_points(
    nodes=reservoir_nodes,
    variables=[
        "water_depth",
        "connected_net_flowrate",
        "reservoir_water_depth",
        "reservoir_storage",
        "reservoir_exchange",
    ],
    interval=1.0,
    name="reservoirs",
)
If the simulation records different variables for different node groups, keep
using separate set_observation_points() calls and then pass the combined
table:
flow.set_observation_points(
    nodes=all_observation_nodes,
    variables=["water_depth", "connected_net_flowrate"],
    interval=1.0,
    name="nodes",
)

flow.set_observation_points(
    nodes=reservoir_nodes,
    variables=["reservoir_water_depth", "reservoir_storage", "reservoir_exchange"],
    interval=1.0,
    name="reservoirs",
)

results = flow.run_simulation(desired_outputs=outputs)
obs_df = flow.get_observation_dataframe()

launch_openkarst_viewer(results, network, obs_df)
The viewer shows one selected observation property at a time. If a selected property is only available for some nodes, such as reservoir storage, nodes without finite values for that property are skipped in the observation plot.
Keep the process alive
When launching the viewer from a script, keep the Python process alive:
if __name__ == "__main__":
    main()
    input("Viewer running at http://127.0.0.1:8050. Press Enter to stop.")